boxplots +
labs(
x = "Region of Boston, Massachusetts",
y = "Average Uber Price"
)
You’ve made a plot with ggplot2, and you want to change the labels of the x and y axes. By default, the axes are labelled with the names of the variables that they display.
Step 1 - Use ggplot2::ggplot() and other ggplot2 functions to create your plot.
Step 2 - Add a set of labels with ggplot2::labs(). Within labs() set x to the x-axis label and y to the y-axis label.
ggplot(data, mapping = aes(x = v1, y = v2)) + geom_point() + labs( x = “label for x-axis”, y = “label for y-axis” )
::: warning
Be sure to add `labs()` with a `+`, placed at the _end_ of the line above `labs()`.
:::

## Example

We're researching the price of Uber rides in Boston, Massachusetts, and we've created a plot that we'd like to share. However, we feel that the default axis labels in our plot are hard to understand.

::: {.cell}

```{.r .cell-code}
library(ggplot2)
boxplots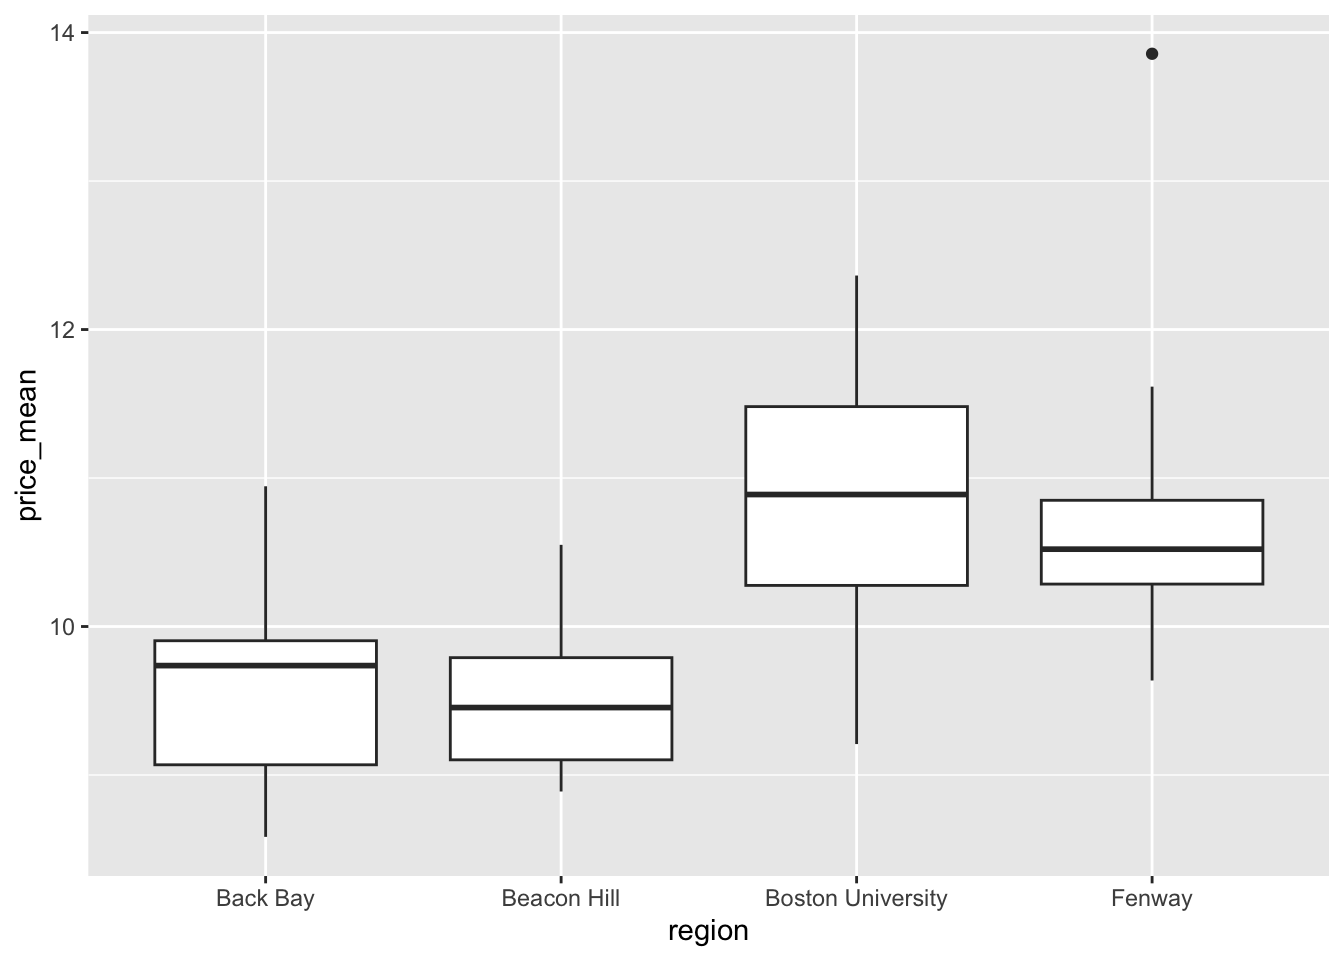
:::
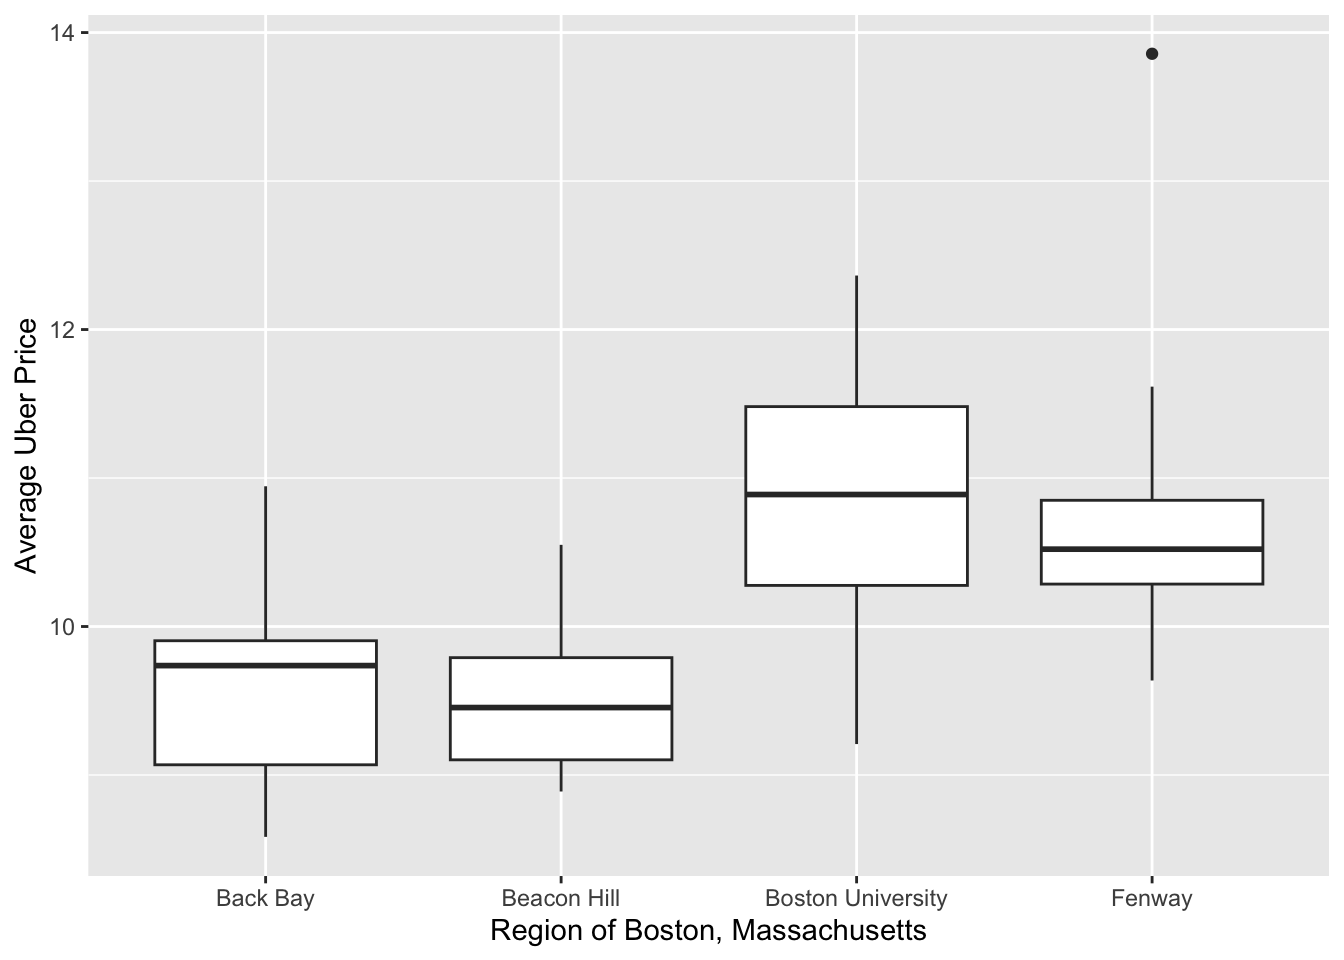
To remedy this, we supply a new pair of axis labels.
boxplots +
  labs(
    x = "Region of Boston, Massachusetts",
    y = "Average Uber Price"
  )
Legend titles
You can use the same method to change the title of a legend that appears in a ggplot2 plot: add labs() and choose a title for the aesthetic associated with the legend, e.g.
ggplot(mpg, mapping = aes(x = displ, y = hwy, color = class)) +
  geom_point() +
  labs(color = "Type of vehicle")
Axis labels in SAS
ggplot() with labs() is the equivalent of SAS’s SGPLOT procedure with the LABEL option following the XAXIS or YAXIS statement:
In SAS: ::: {.cell}
PROC SGPLOT DATA = data_plot;
  SCATTER X = col_1 Y = col_2;
  XAXIS LABEL = 'label for x-axis';
  YAXIS LABEL = 'label for y-axis';
RUN;
In R: ::: {.cell}
ggplot(data_plot, mapping = aes(x = col_1, y = col_2)) +
  geom_point() +
  labs(
    x = "label for x-axis",
    y = "label for y-axis"
  )
:::
:::