Reshape a table from wide format to long
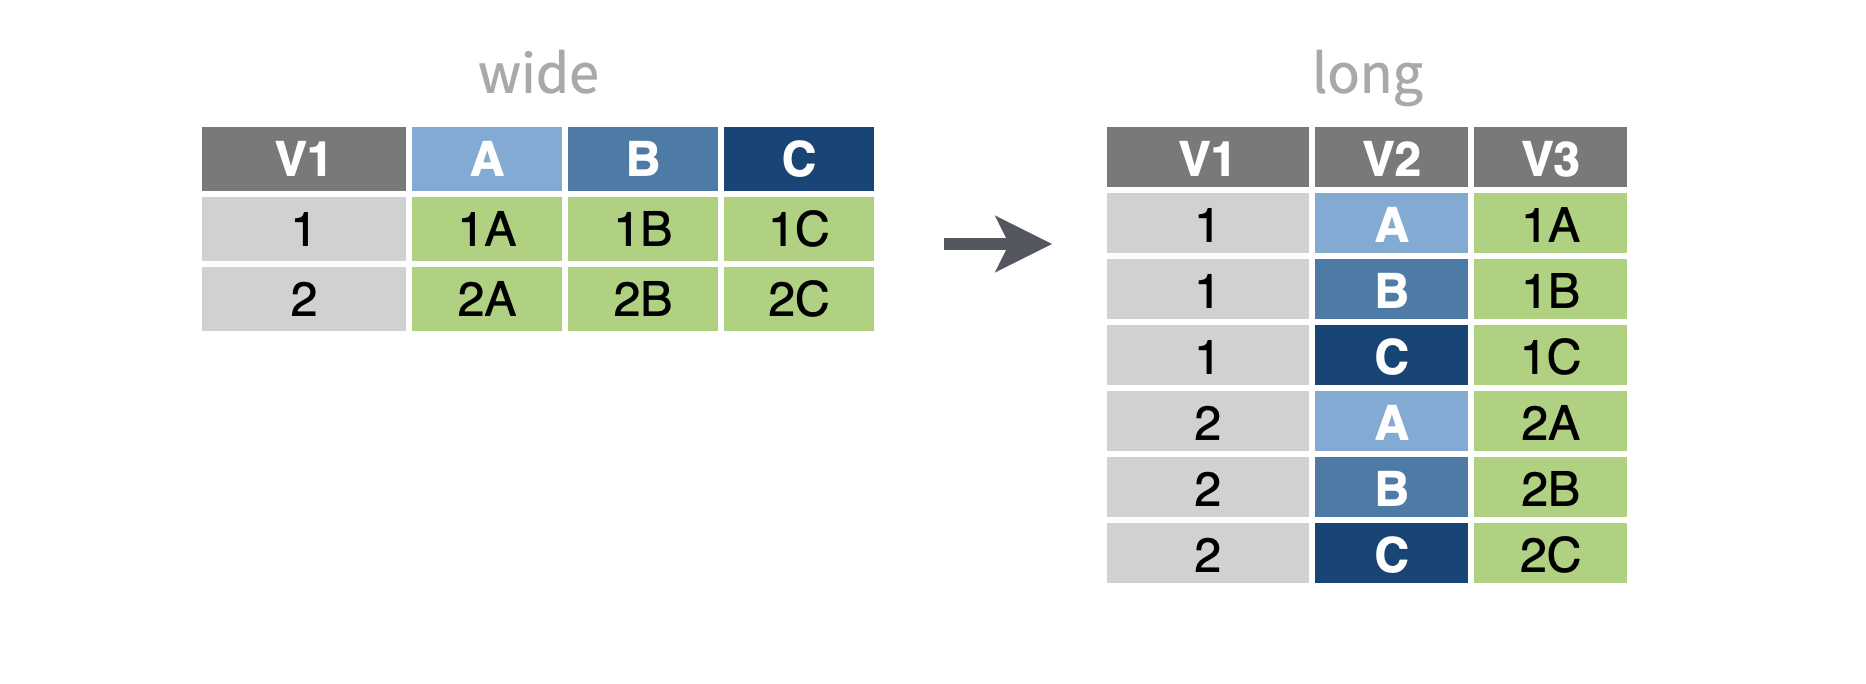
You want to reshape your data frame from a wide format to a long format. In other words, you want to reduce several columns into just two: a column of former column names, and a column of former column values.
Step 1 - Pass your data to tidyr::pivot_longer(). pivot_longer() will return a modified copy of the data frame.
Step 2 - Select the columns to reshape. pivot_longer() will combine these columns into a names column and a values column in the new format. Use ?dplyr::select helper functions to specify columns.
data %>%
  pivot_longer(cols = c(time1, time2, time3))
Step 3- Use names_to and values_to to pick new column names. What should pivot_longer() name the column it sends the current column names_to? And the column it sends the values_to?
data %>%
  pivot_longer(
    cols =c(time1, time2, time3),
    names_to = "time",
    values_to = "count_hrs"
  )
Example
vaccine_wide describes the number of vaccine doses allocated over March, April, and May of 2021 for each vaccine type.
vaccine_wide# A tibble: 3 × 4
# Groups: vaccine [3]
vaccine `202103` `202104` `202105`
<chr> <dbl> <dbl> <dbl>
1 Janssen 137900 139500 34000
2 Moderna 828000 719200 946080
3 Pfizer 1137240 968760 1262880We’d like to plot doses vs. time, but to do that we need to reorganize our data to contain a doses column and a time column.
To begin, we load the tidyr package which contains pivot_longer(). Next, we pivot every column in the data except vaccine. By default, pivot_longer() will return the names column as character data. We don’t want that, so we take advantage of pivot_longer()’s names_transform argument to ask pivot_longer() to run as.numeric() on the names column, which turns the values into numeric data.
library(tidyr)
vaccine_wide %>%
  pivot_longer(
    cols = -vaccine,
    names_to = "month",
    values_to = "doses",
    names_transform = as.numeric
  )
# A tibble: 9 × 3
# Groups: vaccine [3]
vaccine month doses
<chr> <dbl> <dbl>
1 Janssen 202103 137900
2 Janssen 202104 139500
3 Janssen 202105 34000
4 Moderna 202103 828000
5 Moderna 202104 719200
6 Moderna 202105 946080
7 Pfizer 202103 1137240
8 Pfizer 202104 968760
9 Pfizer 202105 1262880Now we are set to make our plot.
library(ggplot2)
vaccine_wide %>%
  pivot_longer(
    cols = -vaccine,
    names_to = "month",
    values_to = "doses",
    names_transform = as.numeric
  ) %>%
  ggplot(aes(x = month, y = doses, linetype = vaccine)) +
    geom_line()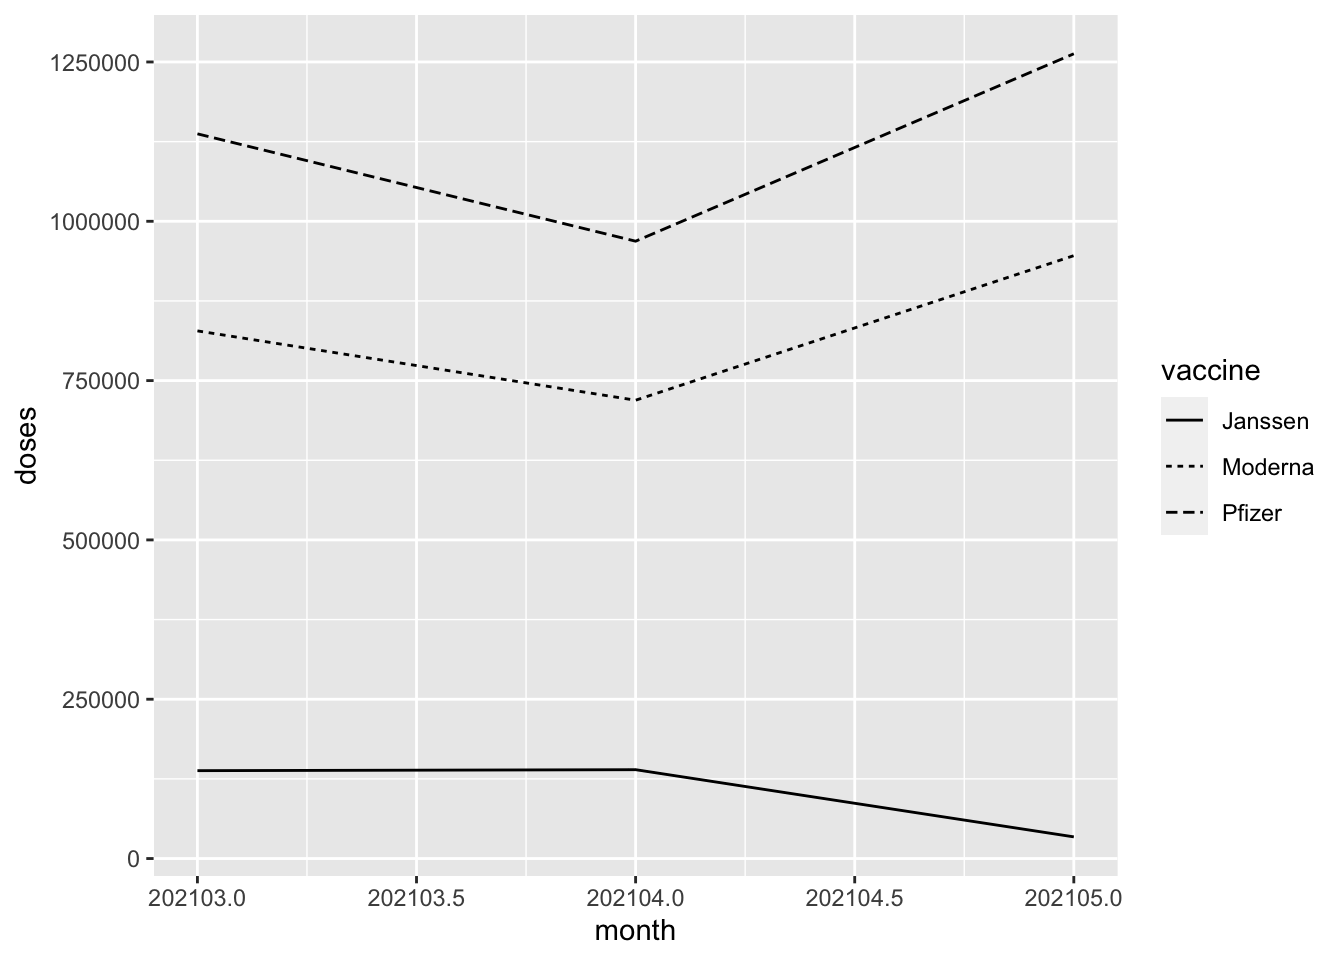
Change the types of the new columns
By default, pivot_longer() will save the former column names as character strings and will make an educated guess about how to save the former column values.
To coerce either column to a different type, set the names_transform or values_transform argument to a conversion function, such as as.numeric().
Reshape table to long format in SAS
Pivoting a data frame from wide to long in SAS is either done with a DATA step and OUTPUT statements or with the TRANSPOSE procedure.
For example, we have a wide data frame with four columns: student_id, d1, d2, and d3 indicating the number of hours each student studied each day.
In SAS:
DATA data_long;
  SET data_wide;

  student_id = student_id;
  day = "day_1";
  count_hrs = d1;
  OUTPUT;
  student_id = student_id;
  day = "day_2";
  count_hrs = d2;
  OUTPUT;
  student_id = student_id;
  day = "day_3";
  count_hrs = d3;
  OUTPUT;

  DROP d1-d3;
RUN;
OR
PROC TRANSPOSE DATA = data_wide OUT = data_long;
  BY student_id;
RUN;
In R:
data_long <-
  data_wide %>%
  pivot_longer(
    cols = c(d1, d2, d3),
    names_to = "day",
    values_to = "count_hrs"
    )