Add a label that spans several columns in a table for publication
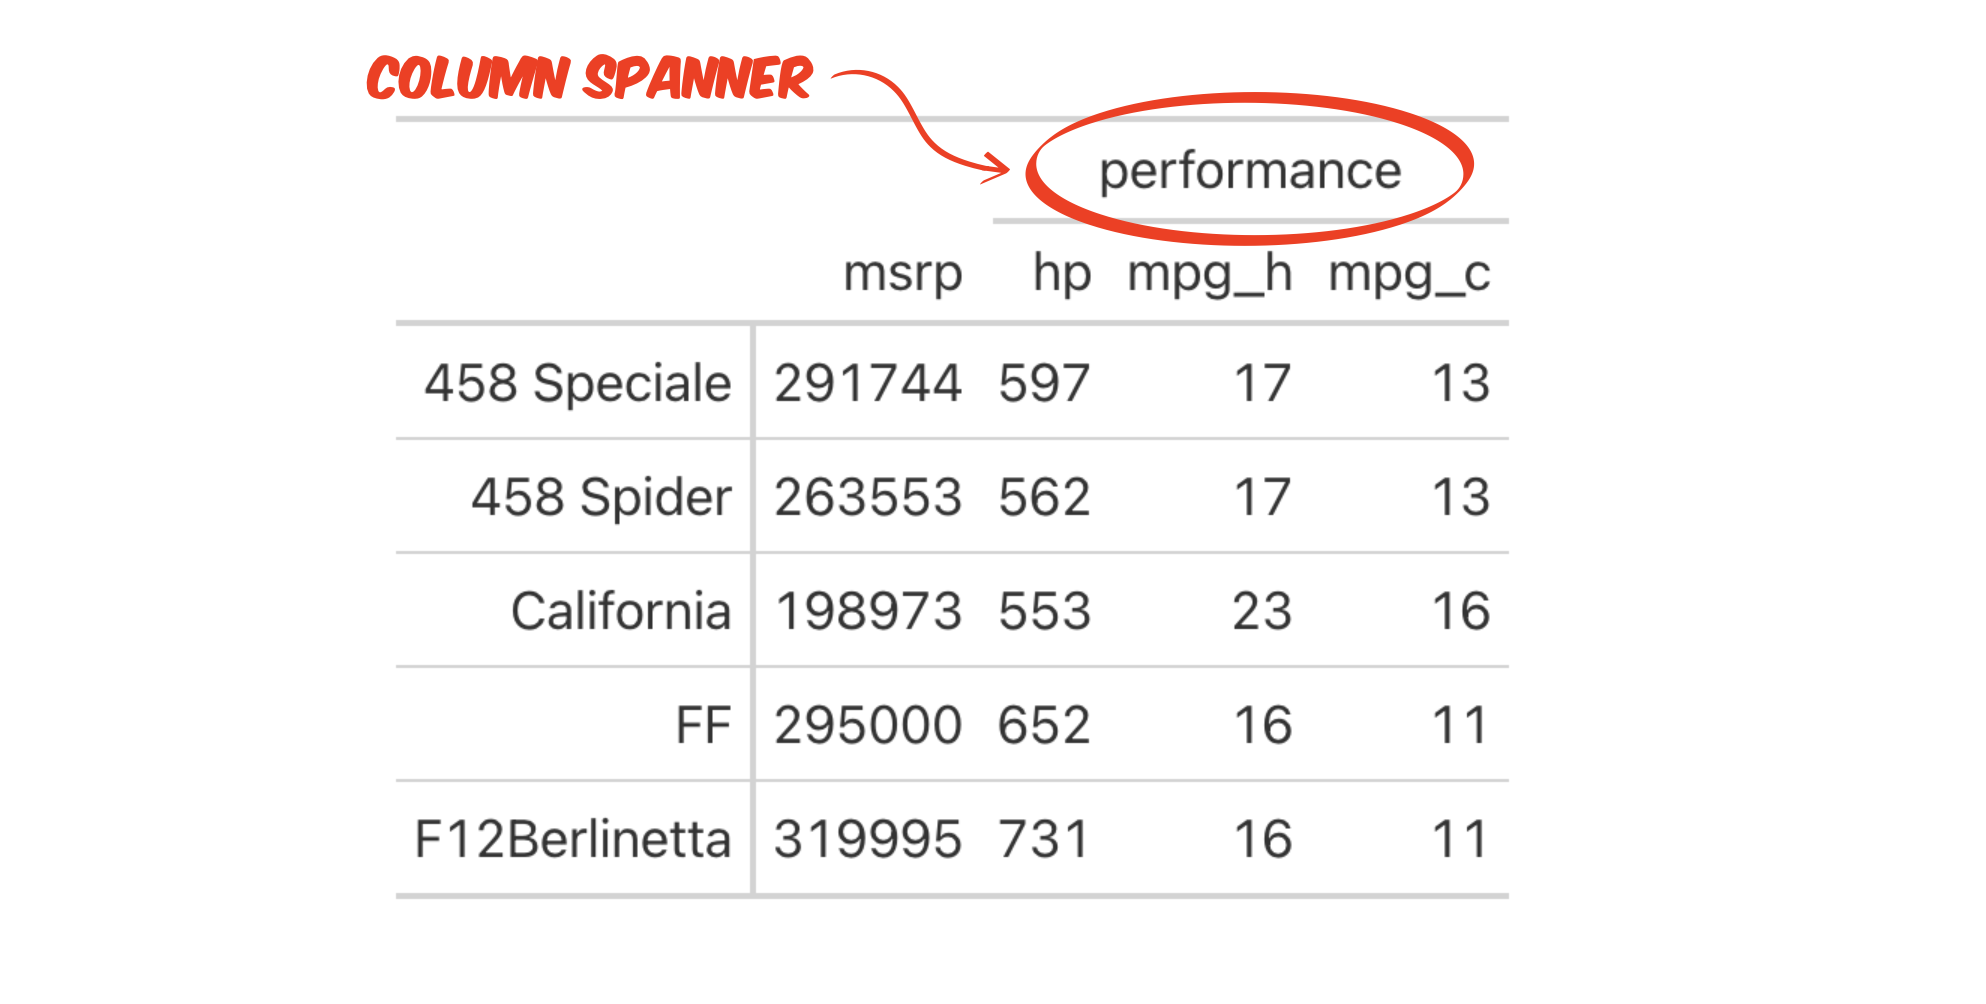
You are making a table for publication, and you want to add a label that spans the space above several adjacent columns, for example to group the columns into a category. This type of label is called a column spanner.
Step 1 - Start with a data frame that contains the values that you want to display in the arrangement that you want to display them.
Step 2 - Use gt::gt() to turn your data frame into an editable, professional looking table.
Step 3 - Use gt::tab_spanner() to add the label. Specify the columns to span with the label. If the columns are not adjacent to each other, tab_spanner() will reorganize the table so that they are.
data %>%
  gt() %>%
  tab_spanner(
    columns = c(col_B, col_C, col_D),
    label = "Label above columns"
  )
Select which columns to span
You can use thedplyr::select() helper functions to select the columns to span. See the ?select() help page for more information
Example
store_sales describes the number of various Quaker oatmeal products sold at three stores during a week.
store_sales# A tibble: 4 × 4
product `8` `21` `44`
<chr> <int> <int> <int>
1 Quaker Instant Grits 12 oz 20 12 3
2 Quaker Kids Choice 14.3 oz 3 7 11
3 Quick Quaker Oats 18 oz 55 21 53
4 Quick Quaker Oats 42 oz 123 18 52The column names 8, 21, and 44 are a bit ambiguous, so before we publish the table, we want to add a label that explains that the columns refer to stores.
To do this, we load the gt package and then convert our data frame to a gt table. Finally, we add a label that spans all three columns.
library(gt)
store_sales %>%
  gt() %>%
  tab_spanner(
    label = "Store Number",
    columns = -product
)| product | Store Number | ||
|---|---|---|---|
| 8 | 21 | 44 | |
| Quaker Instant Grits 12 oz | 20 | 12 | 3 |
| Quaker Kids Choice 14.3 oz | 3 | 7 | 11 |
| Quick Quaker Oats 18 oz | 55 | 21 | 53 |
| Quick Quaker Oats 42 oz | 123 | 18 | 52 |
Column spanners in SAS tables
tab_spanner() is equivalent to SAS’s REPORT procedure with the COLUMN statement to specify spanners for the columns within the parentheses.
In SAS:
PROC REPORT DATA = data;
  COLUMN col_A ("Spanner for columns" col_B col_C col_D);
RUN;
In R:
data %>%
  gt() %>%
  tab_spanner(
    columns = c(col_B, col_C, col_D),
    label = "Spanner for columns"
  )